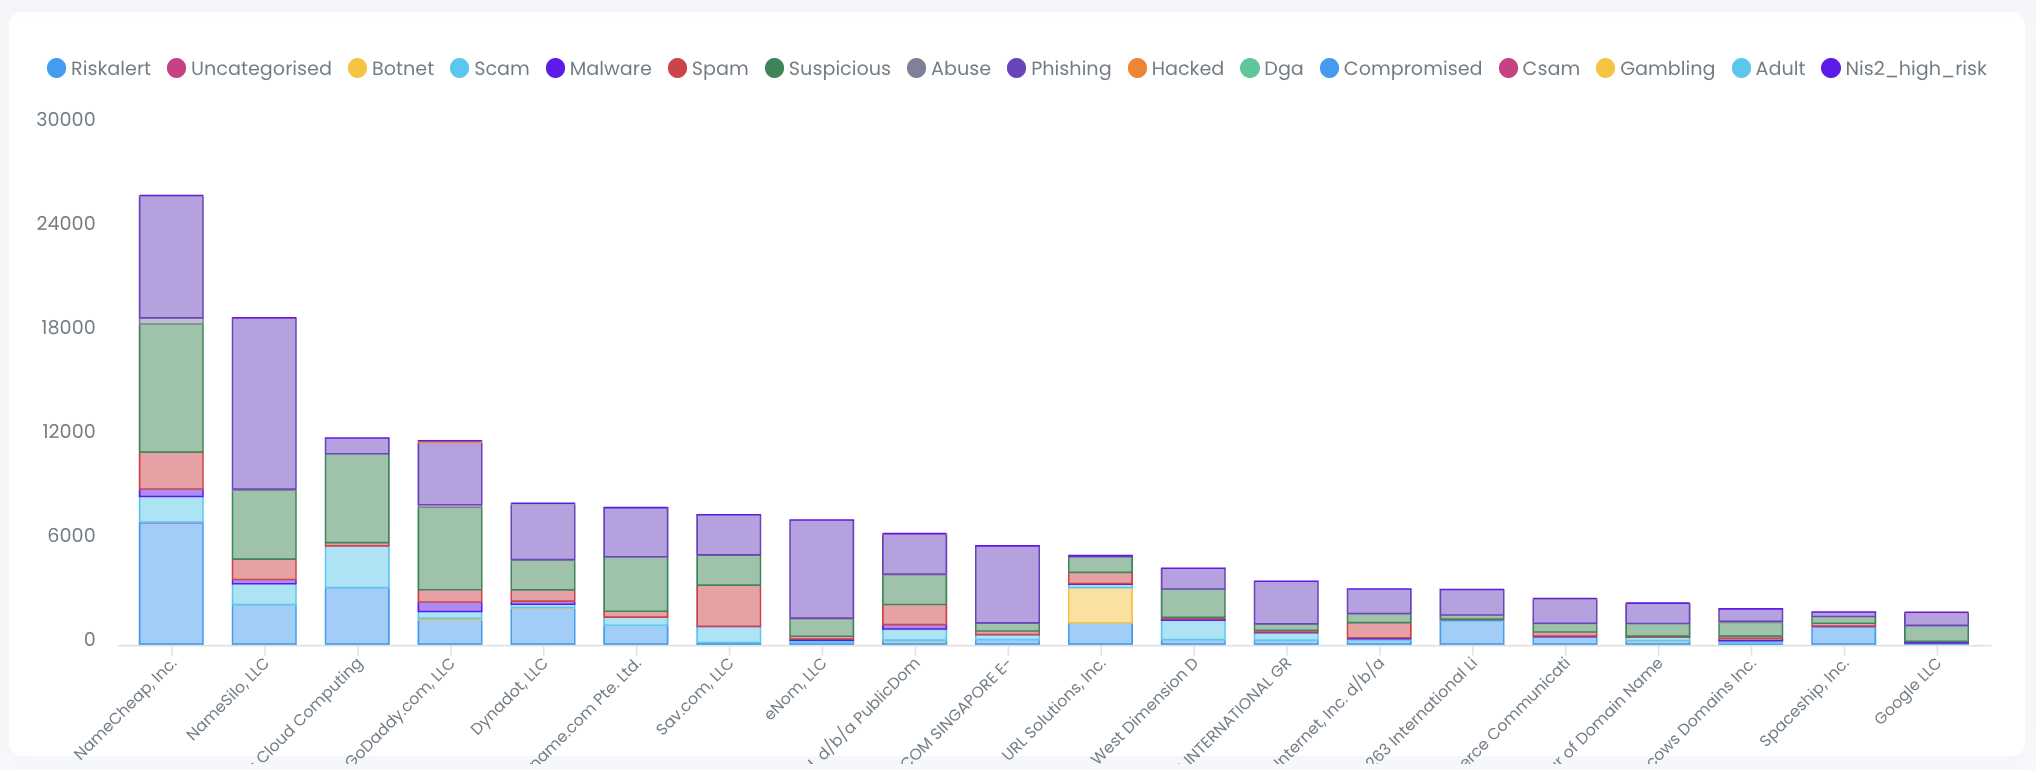
The Abuse Category by Registrar Report breaks down abuse cases by registrar and abuse category, so you can see which registrars are generating the most abuse and what categories are involved.
The chart shows the top 20 registrars by number of abuse cases for the selected period. Each abuse category is represented by a distinct colour, making it easy to compare category distribution across registrars. Click a category in the legend to show or hide it.
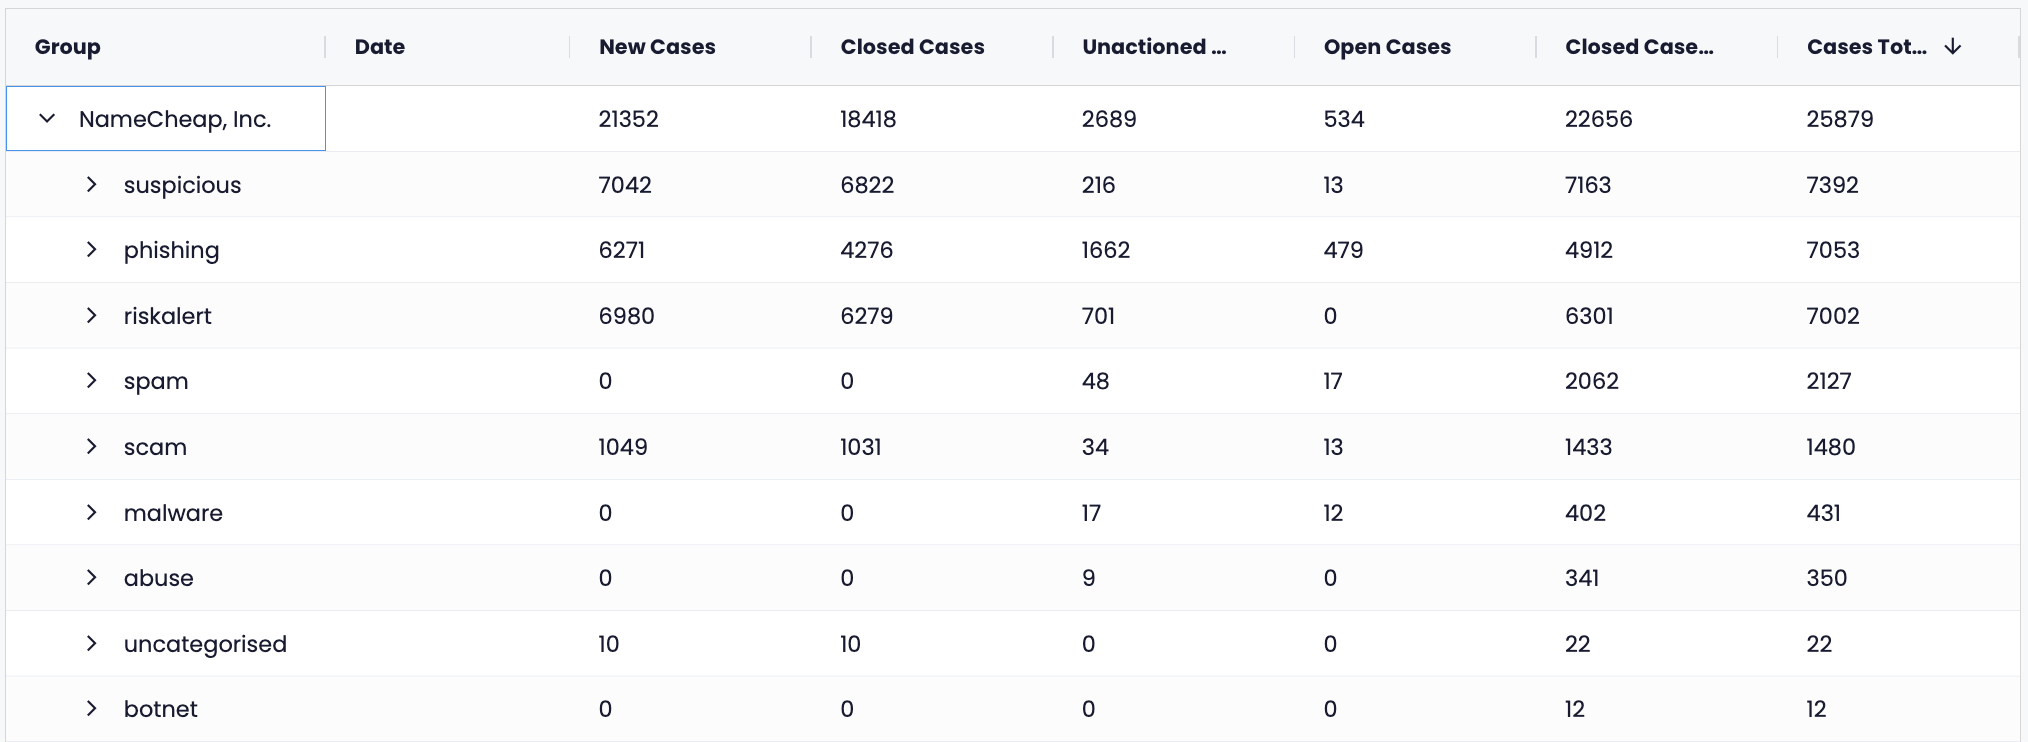
There is a data view below the chart, which provides case numbers by registrar. Expanding a registrar shows the breakdown by abuse category.
The data can be exported as an Excel file