The purpose of the dashboard is to provide an overview of your status right now.
Meaning of Graphs
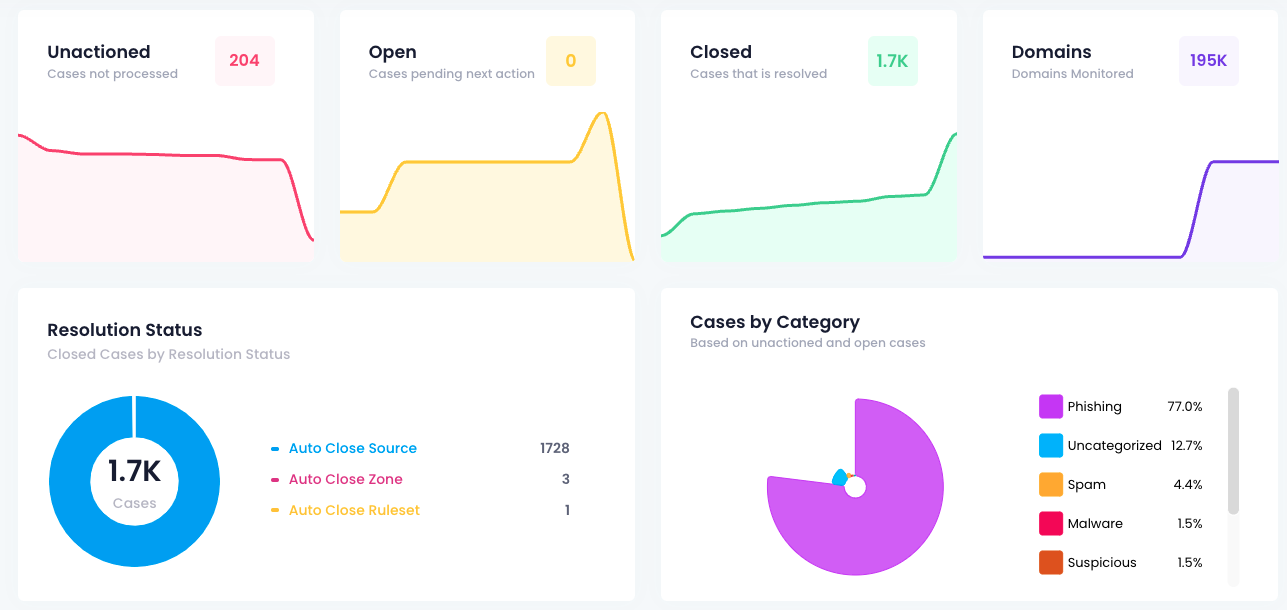
Unactioned: This graph shows the number of unactioned cases at the end of the month (midnight of the last day of the month)
Open: This graph shows the number of open cases at the end of the month (midnight of the last day of the month)
Closed: This graph shows the number of closed cases at the end of the month (midnight of the last day of the month)
Domains: This graph shows the number of domains being monitored. This is a snapshot at the end of the month (midnight of the last day of the month). If you do not have a list of domains, this will show a total number of cases (unactioned + open + closed)
Resolution status: Closed cases by resolution status for all time
Cases by category: Shows the types of cases by category. Only includes unactioned and open cases
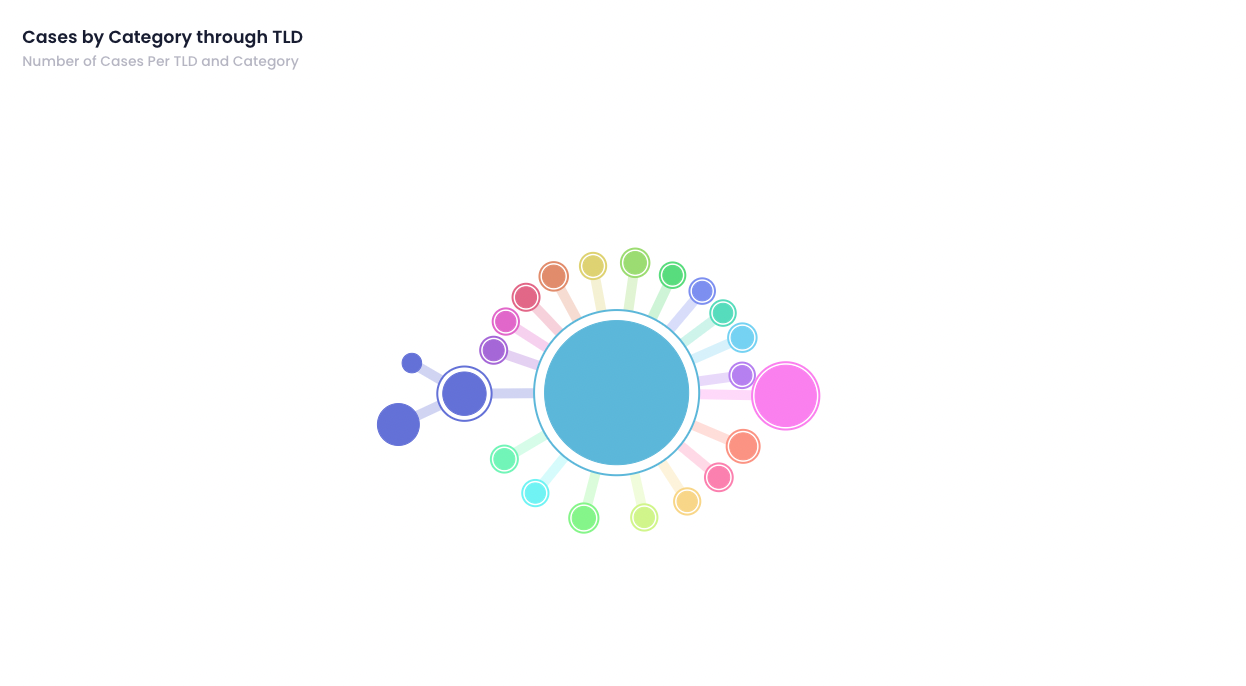
Cases by Category through Registrars /TLD:
The diagram shows the breakdown visually so you can quickly see where the issues are
If you're a Registry, it will display based on Registrars and if you're a Registrar, it will display based on TLD
Only unactioned and open cases are used visualised in this view
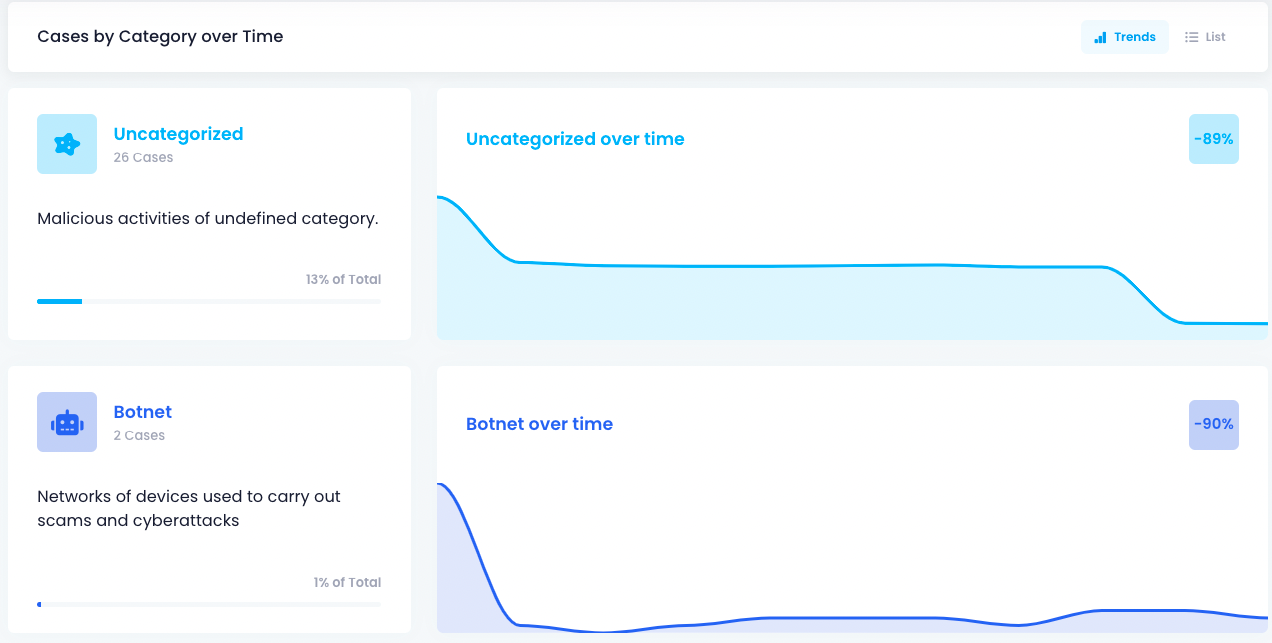
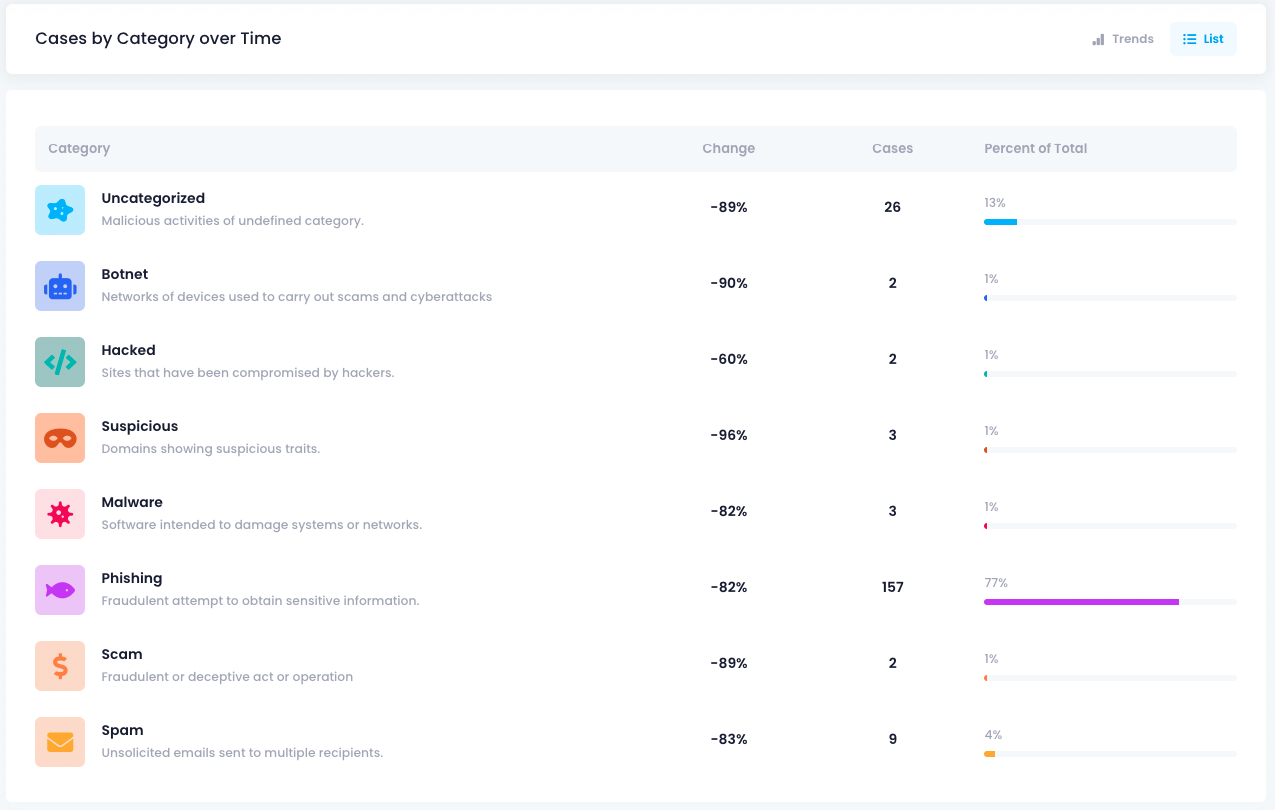
Cases by category over time:
There are two views available
trends
list
The views represent end of month data for unactioned and open cases (midnight of the last day of the month)